One of the advantages of Google Analytics 4 is the automatic tracking of additional events beyond the standard events that the program tracks (such as a page visit or link click). Using this enhanced measurement, you can measure various interactions with the content on your website, including video engagement.
Setting up video engagement tracking
You can activate video engagement measurement under 'Admin' in your Google Analytics 4 property. In this panel, go to 'Data Streams' (in the 'Property' column) and select your data stream.

In your web stream settings, click the checkbox to activate 'Enhanced Measurement', allowing Google Analytics 4 to measure interactions and content on your website. To verify if video engagement is now being measured, click the gear icon and check if the checkbox for 'Video engagement' is activated. If not, it's important to enable this now.

If enhanced measurement wasn't previously activated, it may take about 24 hours before the data from these measurements becomes visible in standard and custom reports.
Analyzing video engagement
By activating enhanced measurement for video engagement, you ensure that Google Analytics measures three events:
- video_start: when a video is played
- video_progress: when more than 10%, 25%, 50%, and 75% of the video is played
- video_complete: when the video has finished
To gain relevant insights about website visitors' engagement with your video content, you can create a custom report (exploration) in Google Analytics 4 under 'Explore'. To start creating your own report, click 'Blank'.

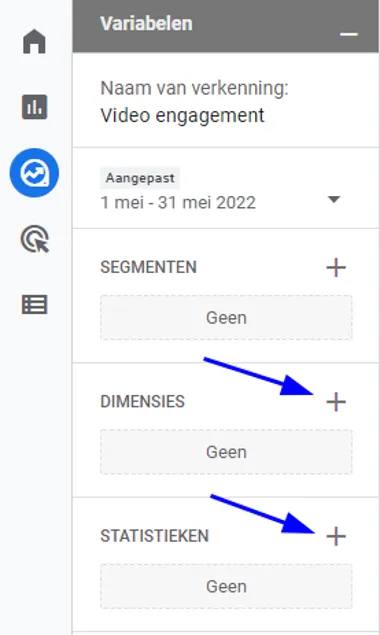
Under 'Variables', you can name your exploration (for example 'Video engagement') and choose the timeframe for which you want to see video engagement. Then add several dimensions to the report by clicking '+'. Here, select the dimensions 'Event name' (under the 'Event' tab) and 'Video URL' and 'Video title' (under the 'Video' tab) and then click 'Import' to add these dimensions to your report.
Additionally, under 'Metrics', you can add various metrics you want to analyze. In this example, we add 'Event count' (under 'Event') and 'Total users' (under 'User').
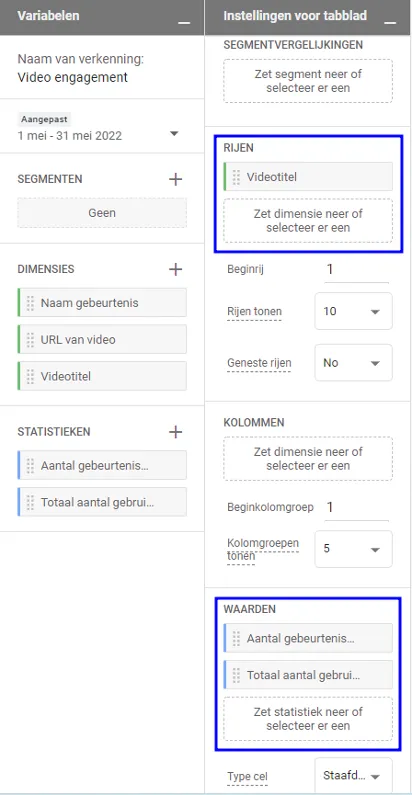
To see the titles of all videos your website visitors have interacted with, for example, double-click on your dimension 'Video title'. This dimension is now added as a row in your report. Then click on both 'Event count' and 'Total users' to add these as values in your report.
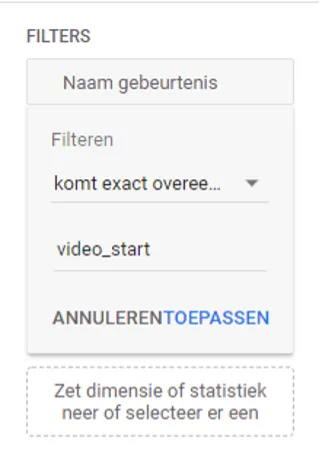
At this point, the report still includes all events, while we only want to see events where a website visitor starts a video (for example). Therefore, you need to filter the report for all videos that visitors have started playing. Do this by clicking 'Drop or select dimension or metric' in the 'Filters' section (in the 'Tab settings' column) and then choosing 'Event name'. In the field that appears, enter: Event name exactly matches video_start. Don't forget to apply the filter.
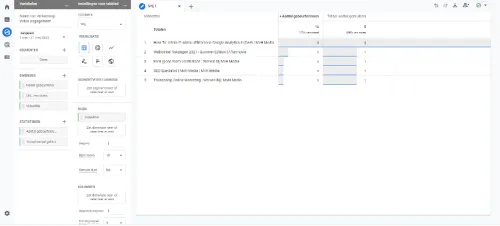
By following these steps, Google Analytics 4 generates a report of all video_start events, showing all videos that website visitors have started. Under 'Event count', you can see how many times a particular video has been started, and under 'Total users', you'll find the number of website visitors who have started a particular video. This metric thus corrects for the fact that one visitor may have viewed the same video multiple times.
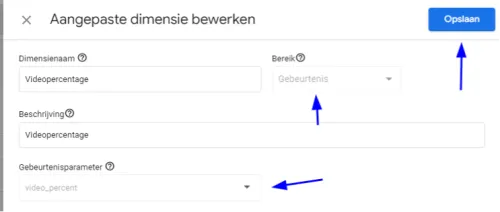
Furthermore, using the video percentage, it's possible to analyze how far a visitor has watched a video. To create a report with these video percentages, you need to create a custom dimension. Do this by going to 'Configure', then to 'Custom definitions' and then to 'Create custom dimensions'.

You can name the dimension whatever you like (such as 'Video percentage'), but always ensure the scope is set to 'Event' and the event parameter is exactly 'video_percent'. Then save the custom dimension. Do this as soon as possible: data collected before the custom dimension was created won't be included in the report. Additionally, it can take up to 24 hours before your data becomes visible. More about custom dimensions and how to use them can be found on our website.
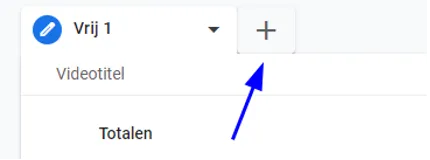
The next step is to create a new tab in your recently created report by clicking '+'.
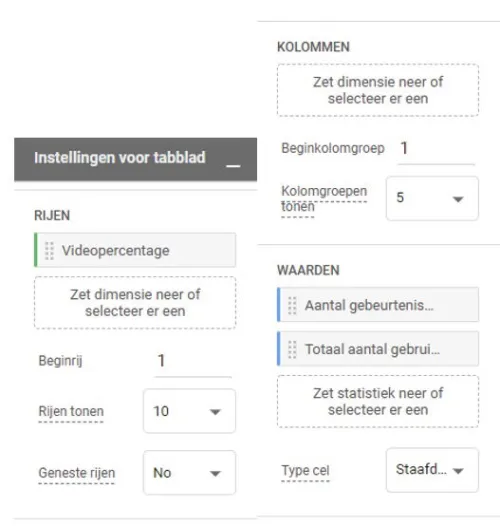
In this tab, you can add the dimension 'Video percentage' (you'll find this under 'Custom') as a row to the report in the same way you added 'Video title' in the previous steps. As values, add 'Event count' and 'Total users' again.
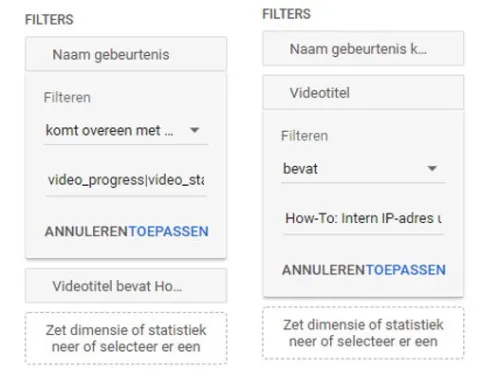
Then create two filters with the following conditions:
- Event name matches RegEx video_progress|video_start
- Video title contains [part of the name of the video you want to analyze engagement for]
Google Analytics 4 then generates a report for the different percentages of your chosen video.
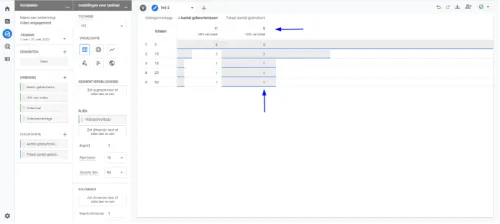
From the example above, you can deduce that five people started this video, but only one person watched more than half of it. No one watched this video completely.
In this example, there's also an event where 16% of the video was watched. This occurs because a visitor watched the video but didn't finish it completely. The YouTube player remembers where a visitor stopped watching. When they return to the page the next day and watch the video again, it plays from where they left off (in this case 16%). Google Analytics 4 then registers a new video_start, which now starts from 16% instead of the usual 0%. The 16% in this report is thus actually a video_start event and not a video_progress event.
Congratulations! You've now created a report where you can analyze your website visitors' engagement with your video content. If you don't see any data in your report after following these steps, first check if events have been registered in Google Analytics 4 related to starting and viewing your videos. If not, it's possible that Google Analytics 4's automatic video tracking isn't working on your website. In some cases, you may need to wait up to about 48 hours before your data appears correctly in the custom reports. Also check if you've selected the correct date range and if all your dimensions, values, and filters are set up correctly. Still not quite getting it or have questions about analyzing your videos or other events in Google Analytics? Then contact Follo's specialists!


