The end is approaching faster for Google's Universal Analytics, and therefore it's high time to switch to the new Google Analytics 4. In July 2023, just half a year away, Universal Analytics will no longer be able to collect data for you unless you have UA 360. With this end in sight, it's crucial to switch to GA4 as soon as possible if you haven't already. Switching quickly means a smaller chance of losing historical data and gives you more time to get used to the new measurement system and the new user interface.
Why now?
After switching, you'll notice that the data you extract from Google Analytics 4 obviously doesn't look exactly the same as what you get back from Universal Analytics. Therefore, it's important to understand the differences in definitions and measurement systems well, to align your new GA4 analyses with what you reported in UA, while also keeping an eye out for any new opportunities within the new system. In a previous article, we highlighted some of the differences between UA and GA4, and in this article, we will delve deeper into them.

We discussed the possibilities under the new measurement system, where triggered events are central. We also briefly highlighted how you can visualize this data through the new Explore functionality. But this is not the only—and not the broadest—way of data visualization for GA4. Therefore, in this article, we explain how to work with your GA4 data in Google's Looker Studio (formerly Data Studio). Finally, we show how you can compare your new GA4 data stream with your old UA data stream using the attached free dashboard.
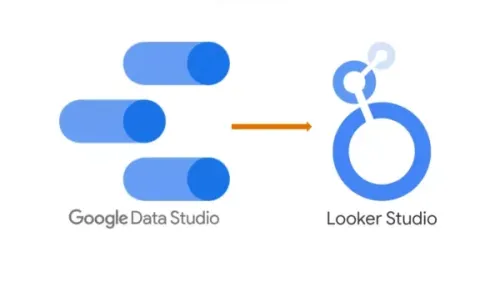
Google Data Studio is now Looker Studio
As mentioned earlier, the transition from Universal Analytics to Google Analytics 4 is not the only change for Google users this year. In early October, Google announced that it would rebrand its data visualization tool Data Studio as Looker Studio. This came as a follow-up to an action that took place in 2020 when Google acquired the company Looker, with the idea of merging it with its so-called Business Intelligence services. This was done, among other things, by Google to broaden its toolset with the tools from the old Looker, making them available to users of the Google Cloud Suite.
The consequences of this acquisition for the former Data Studio have so far been minimal. A new name and a new logo in the top left are so far the only significant changes compared to the old situation. Looking to the future, we do see potentially positive changes. What about the extensive data models that were found in the old Looker? These are currently under review, but this could significantly expand your options in the new Looker Studio.
Now that we've mapped out the name change, we can move on to the consequences of the transition from Universal Analytics to Google Analytics 4, particularly in visualizing your data. Therefore, we will now build on what the best way is to visualize all your new GA4 data in Looker Studio.

What are the best ways to display GA4 data in Looker Studio?
There are several ways to visualize your GA4 data in Looker Studio. Below, 3 methods are explained. The very best way to visualize your GA4 data in Looker Studio is through the free Google BigQuery connection.
Option 1: Connection with BigQuery
Advantages:
- Making the connection is easy and free (note: you may have to pay for running queries and storing data)
- The connection between BigQuery and GA4 works much faster than the other options, resulting in a shorter wait time for the user before the results are loaded
- Higher reliability of the data, as there is no sampling possible
- All raw data is available, and all metrics and dimensions are available
- You won't hit the limits of your daily tokens, so there's no risk of having no data in your dashboard. This is the case with the direct connection between GA4 and Looker Studio after Google's update on November 10 (more about limits: https://developers.google.com/analytics/devguides/reporting/data/v1/quotas). Google announced on November 22 that they are working on a solution to ensure that the limits are higher if you use the direct GA4 connection in Looker Studio https://support.google.com/looker-studio/thread/188075021?hl=en&msgid=189596782
Disadvantages:
- There are minimal costs for BigQuery in the form of running queries and storage, but there is a threshold, where you only have to pay if you exceed it. For example, the first 10GB of data storage is free, and the first 1TB of queries run is free. For the majority of our clients, these thresholds are not exceeded, keeping the costs minimal. More about the costs in the tables below.


- To transform the raw data into tables, you need to be able to write SQL. You can then link these tables to Looker Studio.
Option 2: Connection between Looker Studio and a Google Spreadsheet
A third solution that falls somewhere in between would be to load your data into Google Sheets via data connectors. Then you link these tables to Looker Studio. An example of this would be the Supermetrics connection with Google Sheets.
Advantages:
- Making the connection is easy
- Higher reliability of data, you can avoid sampling and get a clear notification if it does occur.
- You don't need to know SQL to transform the data into usable tables
Disadvantages:
- Most data connectors are not cheap
- With large amounts of data (e.g., data based on pages), you can quickly hit the limits of Google Sheets in terms of the number of cells
Option 3: Direct connection between GA4 and Looker Studio
The second solution is a direct connection between GA4 and Looker Studio. You can then select GA4 as a source within Looker Studio.
Advantages:
- The connection is easy and quick to make
- The entire connection is free
- Creating tables is not necessary, you can choose from the available fields
Disadvantages:
- Sampling can occur when retrieving a lot of data.
- Not all raw data is available, you are limited to the 155 fields available in the API.
- The data cannot be displayed in your dashboard if you exceed the daily token limits as explained above.
Free Dashboard to Get Started with Your Data!
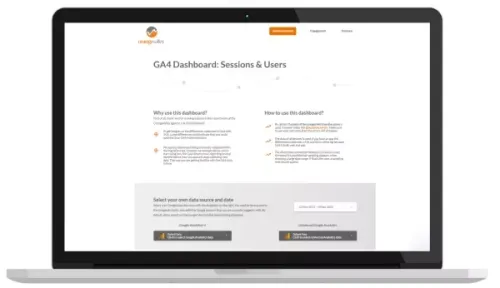
In a previous article, we took a closer look at the differences between Universal Analytics (UA) and Google Analytics (GA4). To make these differences visible, we developed a free dashboard. You can use this dashboard to gain insight into any discrepancies when implementing your data to GA4. For more information, check out the article here or request the dashboard below immediately.

If you want additional information about the connection between GA4 and Looker Studio or need help creating a dashboard based on one of the three connectors, Follo is happy to advise and support you.
```


