Business Intelligence (BI) tools are indispensable for companies that want to gain insights from their data and use these to make better decisions. There are numerous BI tools on the market, but two of the most popular are Power BI from Microsoft and Google Looker Studio. Both offer powerful capabilities to visualize and analyze data, but which tool is most suitable for your business? In this blog post, we compare Power BI and Google Looker Studio on different aspects, so you can make an informed decision about which BI tool best fits your company's needs.
Power BI
Let's start with Power BI. Power BI is developed by Microsoft and offers a comprehensive set of BI tools for transforming data into useful insights. It is a self-service BI platform designed to help both beginners and experienced users create visually appealing reports and dashboards. Power BI is available in both online and desktop versions. This gives users the flexibility to choose how they want to work with the platform and offers advantages for different use cases. The Power BI desktop version is a Windows application that users can download and install. This version provides extensive functionality and advanced capabilities for data modeling and editing, making it an ideal choice for users who want to work offline and perform more advanced tasks. Another advantage of the desktop version of Power BI is that it doesn't have live connections to the data, which means it often works faster than the online version.
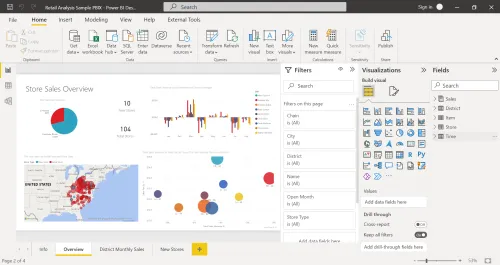
On the other hand, the online version of Power BI offers a more accessible and simple way to start building reports and dashboards. Users can get started right away through their web browser without having to download or install anything. The online version is also convenient for teams collaborating on the same report or dashboard, as it's easy to share reports and data via the cloud.
Google Looker Studio
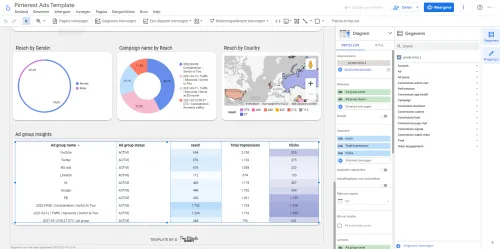
Let's now look at Google Looker Studio. Google Looker Studio is a cloud-based BI platform that was acquired by Google in 2019. It is designed to help businesses visualize and analyze their data in a flexible way. Google Looker Studio does not offer the option to work offline.
Integration
Power BI offers comprehensive support for data sources, including popular databases like SQL Server, Oracle, MySQL, and PostgreSQL, as well as Cloud-based services like Salesforce, Google Analytics, and Microsoft Azure. With more than 160 types of data sources, Power BI can easily retrieve and process data from various applications and databases.
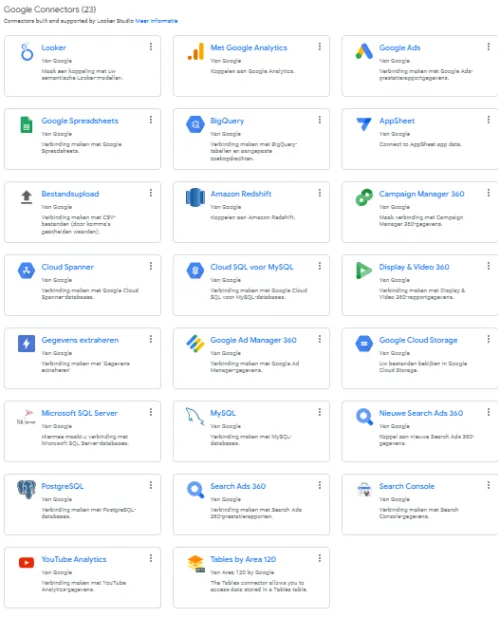
Google Looker Studio offers integration with Cloud-based services like Google Cloud Platform, Amazon Web Services (AWS), and Snowflake. However, compared to Power BI, Looker Studio itself offers less support for different types of data sources. There are 23 different connectors that are built and supported by Looker Studio. However, there are 730 connectors that are built and supported by Looker Studio Partners. To use these connectors, you usually have to pay. Although Looker Studio does have the ability to create these custom connectors, it may offer less flexibility than Power BI in this context.

Data volume
Both Power BI and Google Looker Studio have the ability to process and analyze large amounts of data. Power BI can process datasets up to 10 GB for the Power BI Free and Pro subscription and up to 100 TB for the Power BI Premium subscription. Additionally, Power BI offers the ability to compress data, reducing the amount of storage space needed.
Google Looker Studio, on the other hand, offers storage capacity up to 1 GB. This is thanks to the fact that Google Looker Studio is built on Google Cloud Platform infrastructure, which is scalable and capable of processing huge amounts of data.
Google Looker Studio has limitations for data processing when users directly connect Google Analytics 4 (GA4) and Looker Studio. Specifically, this means that GA4 queries executed through Looker Studio's direct connection are subject to a daily limit of 10 GB of data processing. If a user exceeds this limit, additional charges are incurred. This can add up quickly, as costs are calculated based on the number of bytes processed, with a minimum load of 10 MB.
To avoid these costs, users can choose to first put the data in BigQuery and then transform and send it to Looker Studio. This way, the costs are charged to BigQuery, but Looker Studio's limitations are avoided.
It's important to note that these limitations only apply to the direct connection with GA4. If users load their data into Looker Studio through other sources, there are no limitations on the amount of data processing.
It's a fact that processing large amounts of data can be challenging for BI tools like Power BI and Google Looker Studio, which can ultimately affect performance. While both tools use advanced techniques to optimize performance, they each have their own approach.
Power BI, for example, offers the ability to split data into multiple datasets. This can be useful when working with large amounts of data that would otherwise be difficult to process.
On the other hand, Google Looker Studio offers advanced performance optimization techniques that speed up the processing of large datasets. This includes techniques like caching and compression, making data processing more efficient.
Data blending
In Power BI, data blending is achieved through the use of relationships between tables. With Power BI, users can define relationships between tables based on common columns. When data from multiple tables is combined, Power BI uses these relationships to create a single, unified dataset. This allows users to create reports and visualizations that combine data from different sources. Power BI also offers data modeling tools, such as calculated columns and measures, that can be used to create new data based on the combined dataset.
In contrast, Google Looker Studio uses a different approach to data blending. Instead of relying on relationships between tables, Looker uses a modeling layer that allows users to define their own custom data relationships. The modeling layer is a separate component of Looker that enables users to create custom data models that can be reused across different reports and dashboards. This approach gives users more control over how data is blended and offers more flexibility in the types of relationships that can be defined.
One advantage of Looker's modeling layer is that it allows users to define relationships between data sources that may not have a common column. This can be particularly useful when working with unstructured data or data from different sources. However, the modeling layer can also be more complex and requires a higher level of technical skill to use effectively.
Overall, both Power BI and Google Looker Studio offer powerful tools for blending data from multiple sources. The approach each platform uses may be better suited to different types of users and use cases. Power BI's approach of using relationships between tables may be more familiar to users who are used to working with relational databases, while Looker's modeling layer might be better suited for users who need more flexibility in defining data relationships.
Querying
Querying is an important aspect of data analysis and both Power BI and Google Looker Studio offer powerful query options to help users filter, sort, summarize and manipulate data. In Power BI, the query editor is easy to use and provides an intuitive interface that allows users to easily navigate through data and refine their analyses. The query editor also supports features like filtering by columns, summarizing data, and applying calculations to data, enabling users to manipulate and transform data in a way that suits their specific analysis needs.
On the other hand, Google Looker Studio also offers advanced query options for users looking for more advanced query capabilities. The advanced query options in Looker Studio allow users to create complex queries and optimize data processing performance. This enables users to dig deeper into the data and gain more insights from their analysis. Users can also take advantage of Looker's integration with SQL to query directly in their data warehouse, which helps speed up analysis and improve performance.
Price
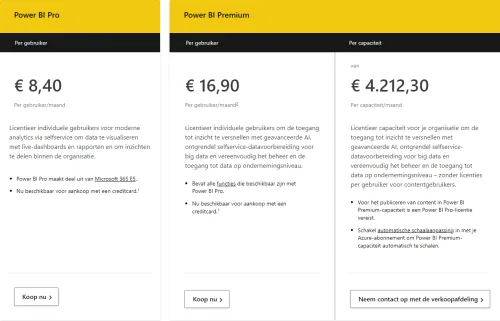
An important difference between the BI tools is the price. Power BI offers both free and paid versions, with the basic version of Power BI being free. Additionally, you can choose between the Pro version and the Premium version, with the Pro version costing €8.40 per user per month. The Premium version costs €16.90 per user per month and €4,212.50 per capacity per month. For larger organizations, there are also special Enterprise packages available, the price of which is available upon request. Google Data Studio is completely free. You only need a Google account to get started.
Visualization
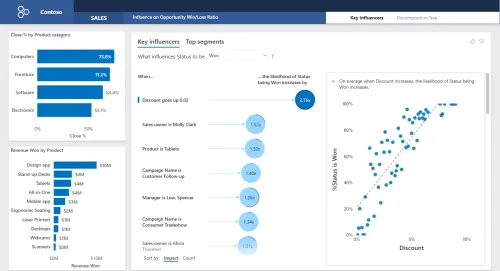
Both platforms offer many possibilities for data visualization. Power BI offers a wide range of visualization tools, including charts, tables and maps, and users can also create custom visualizations with the Power BI Visuals Marketplace.
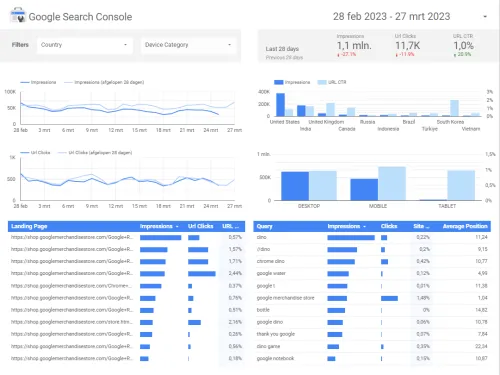
Google Looker Studio also offers a wide range of visualization tools and has some advanced options that Power BI doesn't have, such as the ability to combine multiple visualizations.
User accessibility
Power BI offers extensive user management options, allowing you to determine which users have access to which data. It also has limited access options for external users, such as partners and customers. Google Looker Studio also offers extensive user management options, allowing you to determine whether users can edit or only read the dashboard.
Sharing
Both tools offer capabilities for sharing reports and dashboards with others. Power BI makes it easy to share reports through various channels, including email, SharePoint and Teams. Google Looker Studio also offers various options for sharing reports, including the ability to integrate reports into other applications and share them via links.
Support
Power BI offers comprehensive support options, including documentation, forums, training and a 24/7 support team. Google Looker Studio also offers comprehensive support options, including documentation, forums and a support team that is available 24 hours a day, 5 days a week.
Conclusion
To summarize the differences between Power BI and Google Looker Studio:
Power BI:
- Focused on data analysis and modeling
- Both online and desktop versions available
- More advanced analysis functions
- Support for more than 160 types of data sources, including popular databases and cloud-based services
- Various price levels, including a free version
- Seamless integration with other Microsoft products
Google Looker Studio:
- Flexible cloud-based BI platform that helps businesses visualize and analyze their data
- More flexibility in customizing data models
- Completely free
- Integration with other Google products and third-party software products
In short, choosing the right BI tool depends on your organization's needs and requirements. Power BI is a good choice if you need advanced analysis capabilities and seamless integration with other Microsoft products. On the other hand, Google Looker Studio is a good choice if you want more flexibility in customizing data models and want to create a visually appealing report or dashboard.
Both Power BI and Google Looker Studio are powerful BI tools that enable organizations to gain valuable insights and improve their performance. It's important to carefully weigh the pros and cons of both programs to ensure you make the right choice for your business. Whether it's Power BI or Google Looker Studio, choosing the right BI tool can help you make better business decisions based on your data through strong dashboarding.
