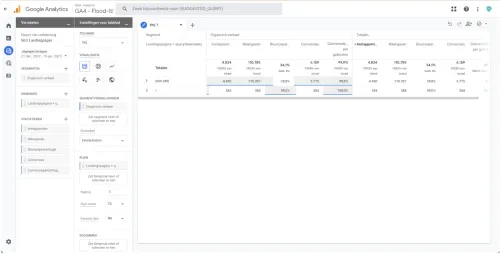
Creating a Report in Google Analytics 4
The phase-out of Universal Analytics is approaching, and from June 1, 2023, the official transition to GA4 has already begun. To have the same insights in GA4 as in Universal Analytics, Google offers the possibility to create custom reports via “explore.” In this blog, I will explain step by step how to build a report in GA4 so you can get started yourself.
STEP 1: CREATE THE EXPLORATION
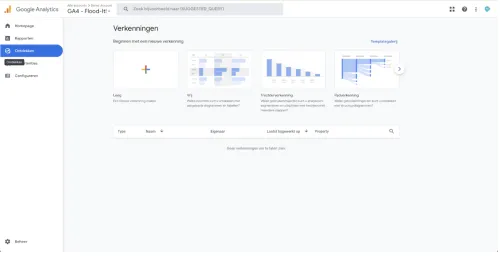
Log in to Analytics.google.com and select your GA4 property. Then choose explore from the menu on the left. Next, choose to create a new exploration (+ blank):
STEP 2: ADJUST THE NAME AND SELECT THE DATE RANGE
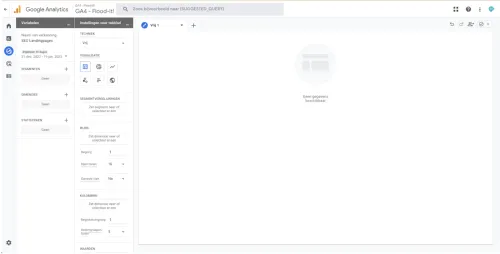
Click on unnamed exploration (the bottom one) in the top left and adjust the name of the report. Choose a clearly recognizable name here. In this example, I chose SEO landing pages and the past 30 days (these can always be adjusted later):
STEP 3: CHOOSE THE RIGHT SEGMENT FOR THE REPORT
Next, we choose the + at segments to add a segment. For this example, we create a segment for organic traffic. We do this through the following steps:
- Choose user segment
- Change the name of unnamed segment to “organic traffic”
- Click on new condition and search for “medium” and then click on “Medium for new user”
- Click on add filter and then fill in the condition “organic” under contains.
- Choose Save and apply

STEP 4: ADD DIMENSIONS
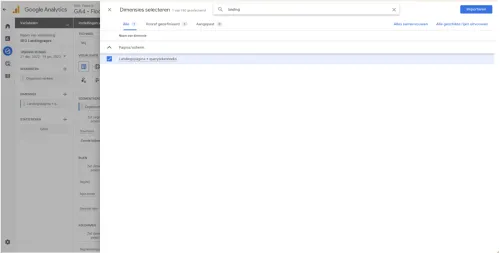
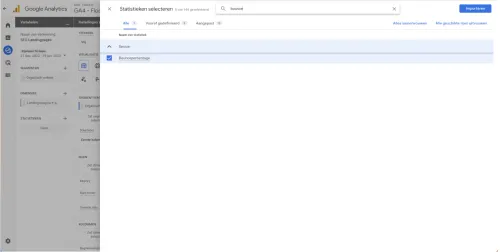
The dimension determines the first column of the table. Since we are creating a report for the main landing pages from organic traffic, we will add a dimension for landing pages.
- Click on the + behind dimensions
- search for landing page
- Select “landing page + query string”
- Choose import
It is also possible to select more dimensions here. Some examples for further analysis of SEO traffic are country (for international websites), location, or device category for more insight into the differences between mobile and desktop.
STEP 5: ADD METRICS
By selecting the metrics, we determine which data is displayed in the table. Beforehand, consider which data you want to have insights into from the organic landing pages. For this example, we use the following metrics:
- Entrances (how many users came to this page on the website)
- Views (How often the page was viewed)
- Bounce Rate (What percentage of users left the site without any other activity after entering this page)
- Conversions (How many conversions users from this segment achieved)
You can add other metrics as desired (up to a maximum of 10).
We add the metrics in the following way:
- Click on the + behind metrics
- Search in the search bar for the above metrics and check them
- Once you have selected all metrics, click on “Import”
STEP 6: ADD EVERYTHING TO THE REPORT
We have now imported a segment, a dimension, and multiple metrics, but the table is still empty. The final step is to add the selected fields to the report. We go through the following steps for this:
- Leave the selection on free at technique
- Leave the selection on table at visualization
- Double-click on “Landing page + query string” under dimensions (you will then see it appear under rows in the settings)
- Double-click on all metrics (wait until the table is loaded before clicking on the next one)
