The news that Universal Analytics (UA) is going to stop and that there needs to be a switch to Google Analytics 4 (GA4) has been known for a while, however, GA4 may not always seem complete at first glance. When you click through the reports in GA4, you might miss options you were used to having in UA.
An example of this is the e-commerce report. In UA, this report is divided into product performance, sales performance, and transactions. When you go to the e-commerce purchases report in GA4, you actually only get insight at the product level.
Google regularly releases updates for GA4, so hopefully, all the statistics you are used to will return. In the meantime, there is fortunately an alternative in GA4, namely: Explore. Under Explore, multiple reports can be found, but this blog zooms in on the free exploration.
Components of the Report
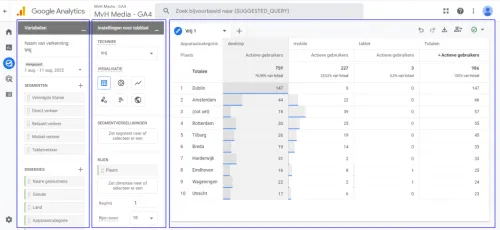
To get into the report, click on Explore in the left bar in GA4. Then you can choose Blank, Free, Funnel Exploration, Path Exploration, or Segment Overlap. These are all interesting explorations to dive into, but for now, we choose a Free exploration. When you open this report, it is automatically filled by GA4 with a standard configuration. Let's first start with the components this report is built from: Variables, Tab Settings, and the Output.
Variables
General Settings
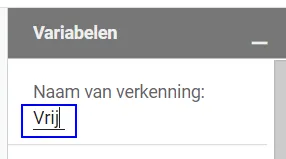
On the left is the variables section, where you can select the data you want to use for the exploration. The section is divided into Date Range, Segments, Dimensions, and Metrics. You can also change the name of the exploration here, simply by clicking on the current name.
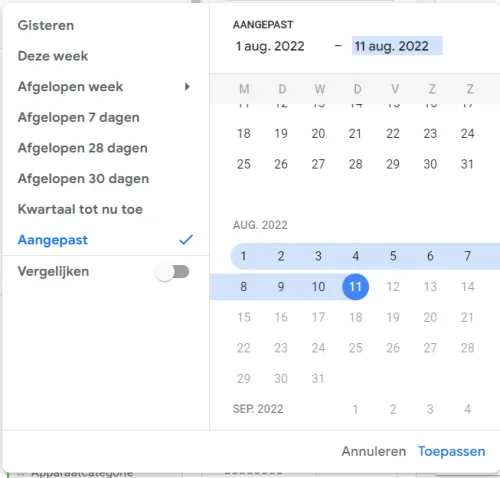
Below that, you can adjust the date range. This works pretty much the same as in the normal reports of GA4. When you click on it, you get a number of predefined choices like 'last 28 days', but you can also click on custom at the bottom and choose a range yourself. Additionally, you have the option to enable comparison, allowing you to compare two periods with each other.
Segments
If you want to gain more insight into certain groups of users, you can define these under segments. There are a number of segments that are standard in GA4, but you can also create your own segments. The segments are divided into 3 categories: user segments, session segments, and event segments. For now, we won't zoom in too much on that, but if you want to know more, check this blog.
Dimensions and Metrics
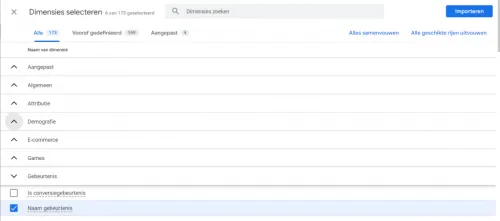
The dimensions in Google Analytics 4 are attributes of an event (or transaction, user, etc.) that describe the event. The dimensions themselves do not contain any real value, but they do help to measure or describe the event. To actually measure something, the dimensions must be combined with metrics. An example: you can select 'event name' in dimensions, but to get an overview of this, it is necessary to add the metric 'number of events'. You add a dimension or metric by clicking on the plus sign next to it. You can choose from one of the predefined dimensions of GA4 or the custom dimensions you have set yourself. If you don't yet know how to create a custom dimension, take a look at this blog. The dimensions are categorized, but it is also possible to use the search function. You can also go through the same steps for the metrics.
Tab Settings
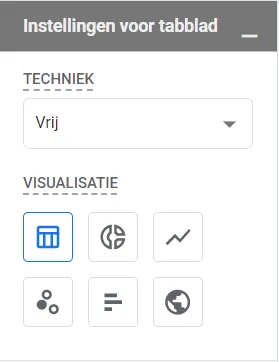
In this section, you can adjust settings for the output. Under the technique heading, it is possible to adjust the type of exploration we chose when opening the report. Below that, you can adjust the visualization. By default, this is set to table, but you can also choose: a pie chart, line chart, scatter plot, bar chart, or geographic map. For now, we'll stick with the table.
Segment Comparisons
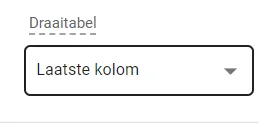
Under segment comparisons, you can add up to 4 different segments. With the pivot table options, you can choose where the segments will be placed in the report relative to the dimensions. You can choose between front or back in the row and front or back in the column.
Rows, Columns, and Values
In the rows and columns, you add the dimensions you previously selected in the variables section. In the values, you add the previously selected metrics. You can do this by dragging them from the variables to the settings. In the example report, the location where the user connects is set against the device category. Then, in the value, the metric active users is added. This way, you can see, for example, how many active users visited the website in Amsterdam via mobile phone.
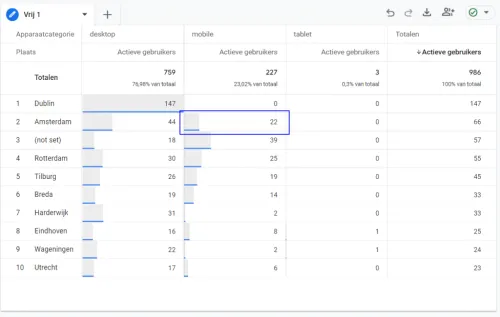
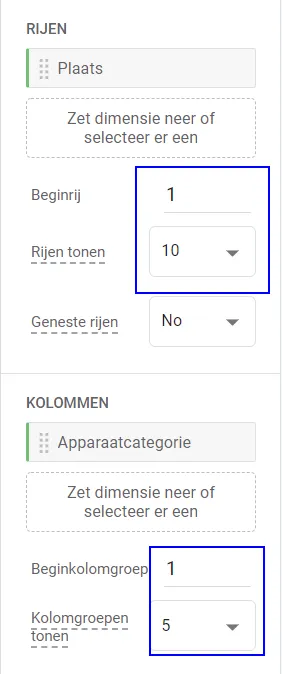
Furthermore, it is still possible to set how many rows and columns you want to see in the report and on which column or row you want to start. In the table itself, it is possible to sort the columns from high to low (or vice versa) by clicking on the dimensions (in this case, location or active users).
Below that, it is still possible to choose the cell type in values. This changes the visualization of the value in the cell. Currently, this is set to bar chart, so cells with a higher value contain a longer bar than cells with a lower value. It is also possible to choose a heatmap or to disable this function.
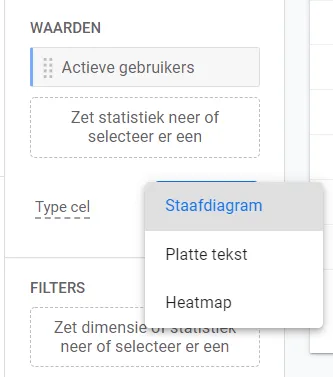
Finally, it is still possible to filter the data. When you click on this, you automatically see the dimensions and metrics you can filter on in this report. When you have chosen one of these dimensions and set the further conditions of the filter, you automatically see the available options.

Output
This blog post started with the problem that there is (still) no transaction overview to be found in the standard GA4 reports, so we are going to create this now. To ensure you don't have any "trouble" from the standard report that Google itself generates in the free exploration, we now start with a blank exploration (via the Explore homepage). A blank exploration also starts as a free exploration, but no variables have been added here yet.
We start by adjusting the name, in this case, I chose Transaction Overview. For the date range, I choose the last 28 days. I skip the segments for now, I want insight into all transactions. You can make the report as simple or extensive as you want. Actually, only 1 dimension and 1 metric are needed for a transaction overview. Under e-commerce, choose Transaction ID for the dimensions and purchase revenue for the metrics. Then drag Transaction ID to the rows and purchase revenue to the values. In the output, you now see a very simple report of your transactions.
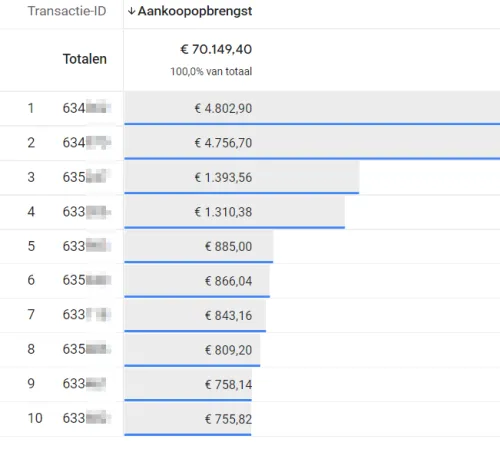
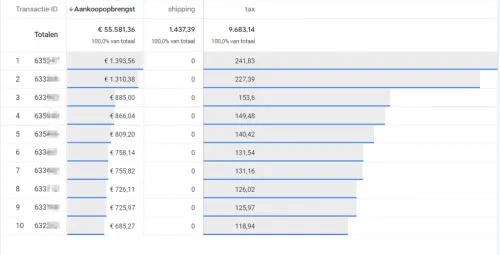
By default, you only see the first 10 rows, but if you want to see more transactions, you can of course increase this. The transactions are now sorted by purchase revenue, but if you want them in order of Transaction ID, just click on this dimension at the top left. This report can of course be expanded further. You can, for example, add the item name and item revenue to specify the contents of the transactions. You can also add the date to make sorting a bit easier. Additionally, it is also possible to add custom dimensions and metrics. In this case, I have created metrics for shipping costs and tax, as these are not standard in GA4.
Finally, a few tips:
- The order in which the dimensions and metrics are in the settings is also the order in which they appear in the output.
- You can also export the data by clicking on the download icon at the top right of the output (1).
- When you work with multiple people under different accounts in the same GA4 property, the explorations are not visible to everyone. By default, these are set to private. To make the exploration available to everyone, click on share exploration at the top right (2).
I hope you have learned something about the free explorations in Google Analytics 4 and that you will work with them a lot! If you still can't figure it out or have questions, you can always contact the specialists at Follo!
```


