In our previous article, we discussed the differences in definitions between Universal Analytics (UA) and Google Analytics (GA4). The key metrics differ slightly in how they are measured. However, at the stage where you have both GA4 and UA running, you would ideally want to compare the results. On one hand, because significant discrepancies might prompt you to reconsider the implementation, and on the other hand, because you want to become aware of the different figures once you fully transition to GA4. This way, you will become familiar with the metrics and dimensions and what they actually mean compared to the known values in UA.
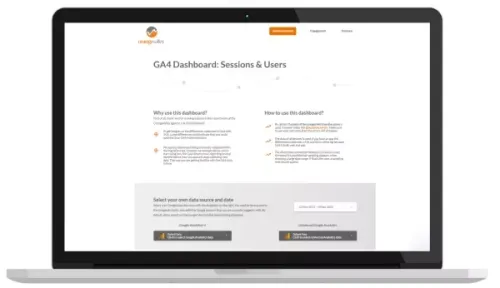
To help you visualize the differences, we have developed a dashboard.

Differences GA4 and UA
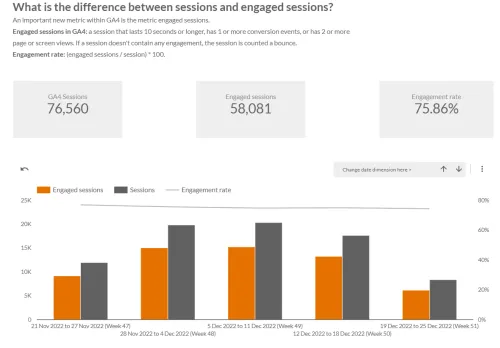
The purpose of the dashboard is to spot significant discrepancies between GA4 and UA during the implementation phase. Significant discrepancies could indicate that the GA4 implementation needs to be refined. Additionally, the second goal is to become familiar with any small differences you see between GA4 and UA. Therefore, each chart also explains the definitions of the metrics and why you might see certain discrepancies.
This dashboard uses the direct GA4 connection with Looker Studio. Since October, Google has changed the name of Google Data Studio to Looker Studio. See also our article ‘Getting Started with GA4 and Looker Studio‘.
Note!
Using this connection means that sampling can occur when selecting large datasets. If this is the case, a notation should appear next to the chart. Additionally, the data from the Google Merchandise store is shown before you select your own accounts. You will see that this data contains errors because the token limits for this property have been exceeded. Once you select your own accounts, the errors will disappear. Unless you have also used up all the tokens for your account.

The dashboard is inspired by Krista Seiden's GA4-migration dashboard. We have added our own twist, placing more emphasis on why the differences between UA and GA4 might occur after identifying them.
Get Started with Your Own Data!
We hope you can use the dashboard effectively to recognize and explain differences between your UA and GA4 implementation, allowing you to approach the upcoming deadline with confidence.
If you need help creating dashboards for GA4 or have other questions about using Google Analytics (4), Follo is happy to advise and support you in this process.


