```html
The transition to GA4
As a Google Analytics user, you are likely at the point where you have mostly completed the setup of Google Analytics 4 (GA4). The data is now flowing in, and you can obtain the first insights from the web data based on GA4 data. After years of working with the old familiar Universal Analytics (UA), it is now time to become familiar with GA4. Such a transition can be considered intimidating, but GA4 actually has a number of very nice new features that are really a step forward to gain more and better insights into your data. In this article, we are happy to highlight these.

New definitions
A new measurement system
To get the right results from your data, you need to know how to interpret the data and what the changed definitions are. In Universal Analytics, a large part of the data is built using various types of 'hits', such as 'pageviews', 'events', 'Social', and 'E-commerce'. Event hits are categorized using a 'Category', an 'Action', and a 'Label'. These names are not used in Google Analytics 4; instead, all these 'hits' in GA4 are seen as 'Events'. These events have their own names and the options to attach various parameters to them. This way, you can send extra information with each event to get a complete picture of each event on your website. If you have a webshop, you can send the name of the product and its price with the 'add_to_cart' event. This way of grouping makes it easier to have a nice overview of the actions your customers do and do not take on your website.
But with a new measurement system, there are logically also changes in how certain metrics and dimensions are defined. Fortunately, the differences are minor and quite simple to understand. The main differences are the following.
New definitions of popular metrics
Four important adjusted metrics are users, sessions, conversions, and bounce rate. The differences are not large but have an impact on the monthly numbers. For example, at the user level, a new metric will be used as the primary metric, namely Active Users, where previously Total Users was used. An active user is a user who has a session with engagement. In your reports within the interface, you will still encounter the term Users, but actually, the number of Active Users is shown here, which will differ from Universal Analytics.
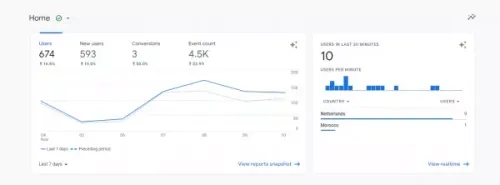
The number of sessions will also differ in GA4 compared to GA4. In GA4, a session is measured as an event (session_start), and no new sessions are started at midnight or when new campaign parameters are encountered. In Universal Analytics, a session is a period in which a user has active engagement with your website or app. The session ends after 30 minutes of inactivity (depending on the session timeout settings), at midnight (according to the time zone set for the view), and when new campaign parameters are encountered. A new session is started after a session timeout, if the user is on the website at midnight, and if a user retrieves new campaign parameters on the website.
In terms of conversions, there are two differences. First, many B2B websites in Universal Analytics created goals for measuring conversions. In GA4, conversion events must be set up for measuring conversions. Second, a goal in Universal Analytics is recorded a maximum of once per session, but a conversion event in GA4 is recorded in all cases when the conversion occurs. These differences provide a more relevant picture of your customers by focusing on active customers who can indeed convert multiple times per session.
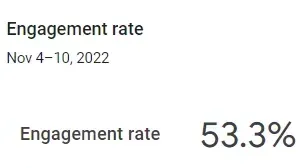
When GA4 was announced to the general public, it quickly became apparent that the bounce rate seemed to disappear. Bounce rate is a metric defined in UA as the percentage of sessions in which one page is loaded and no interaction takes place on a page. In GA4, this metric cannot be found. Instead of looking at the sessions where no interaction took place, the focus is on the sessions where there was interaction. The metric is called Engagement rate in GA4, which is defined as the number of engaged sessions divided by the total number of sessions over a certain period. An engaged session is a session that lasts 10 seconds or longer, has 1 or more conversion events, or has 2 or more page or screen views. Meanwhile, the bounce rate is also available in GA4; its definition is actually the opposite of the engagement rate. However, we prefer to use the engagement rate because it provides more information.
Making the transition from Universal Analytics to Google Analytics 4 easier?
The transition to GA4 can be a challenge, which is why Follo has created the free Google Analytics 4 vs Universal Analytics dashboard to facilitate this transition. We hope you can use the dashboard well to recognize and explain differences between your UA and GA4 implementation, allowing you to approach the upcoming deadline with confidence.
If you need help creating dashboards for GA4 or have other questions about using Google Analytics (4), Follo is happy to advise and support you in this process.
New possibilities to create custom reports
The next step is to view the results of the above metrics using a report. What immediately stands out when opening GA4 is that there are far fewer standard reports under the Reports heading in the left menu. We do see a few familiar items, such as 'Realtime' and 'Acquisition'. And under 'engagement', we see overviews such as 'Conversions' and other event-based analyses. However, these are far fewer than are visible by default in UA. This is because you have the option in GA4 to perform and set up many more analyses yourself. This can be done in two different ways:
- Create custom reports within “Explore”
- Add your own created reports to your left menu under “Reports”
Below we describe both possibilities.
Create custom reports within “Explore”
An advantage of the custom reports is that more different templates are available to help you find answers to various questions. Choose the option from the template gallery to view the options. Choose an example from the template and delve deeper into the quality of your customer journey by creating a funnel analysis, or if you want to know which customer journeys are most common on your website, choose the page path view.
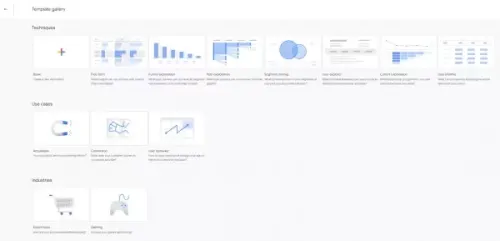
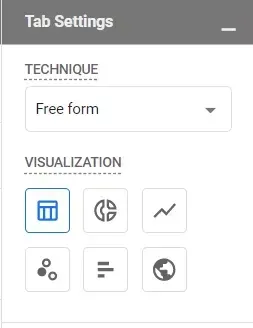
You can also choose a blank file to design your report yourself. Here too, you have multiple visualization options. This is a great advantage because it gives you more opportunities to interpret and convey your results well. You can choose from different techniques, and you can also choose funnel visualization, for example. Additionally, you can choose a free form, pie chart, line chart (where you can easily zoom in and out on date level), a scatter plot, bar charts, and a map.
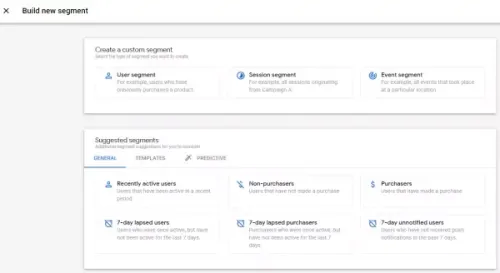
Another important advantage of creating custom reports is the ability to apply various more advanced segments. There are standard segments available based on user, event, and session. But you can also choose advanced segments, such as users who have not made a purchase or even choose from one of the segments based on predictive models. This makes it clear which users are most likely to make a purchase in the next 7 days.
Then you want to share a nice report with colleagues; as a user, you have several options. The easiest method is to share the report in the overview section. The downside is that you can only share the report with view rights. The recipient will therefore not be able to make simple adjustments, such as selecting a new date range. The solution is to make a copy of the shared report so that you can then change the reporting period or make other edits.
Add your own created reports to your left menu under “Reports”
Another way to create and view reports is by adding them to the navigation. This is the ultimate way to completely customize the interface to your needs and objectives. You need an editor role to create a collection. Each property can contain a maximum of 7 collections. Note that this is immediately adjusted for every user of this interface. You can add a report to the left menu by clicking the library icon that appears at the bottom of the reports menu. Then select one of the ready-made reports or create a new report by clicking the “+Create new Report” button.
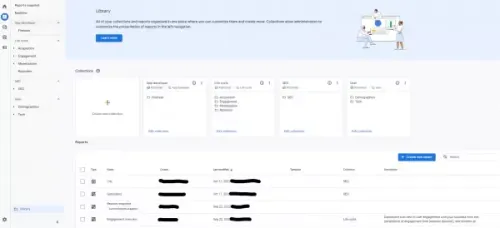
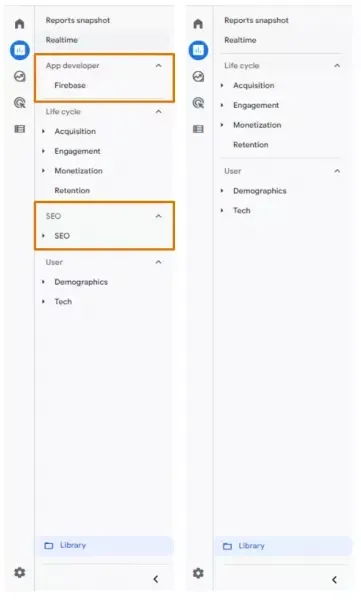
In this example, we have created a separate section with reports relevant to the SEO team and the App developer.
Get started with GA4!
In this article, we mentioned how you can gain valuable insights within the GA4 interface. We also showed what the possibilities are to share and continue using these reports.
The new interface requires getting used to, and there are fewer ready-made reports; on the other hand, there are many more possibilities to customize the entire interface to your liking. So get started!
If you need help setting up these custom reports or have questions about using Google Analytics (4), Follo is happy to advise you on the possibilities and features of GA4.
However, if you want to use reports and dashboards for which you do not have to dive into the interface, we will tell you more about that in a next article!
```
